Can Ethereum Smash Through Resistance Or Stall After Rally?
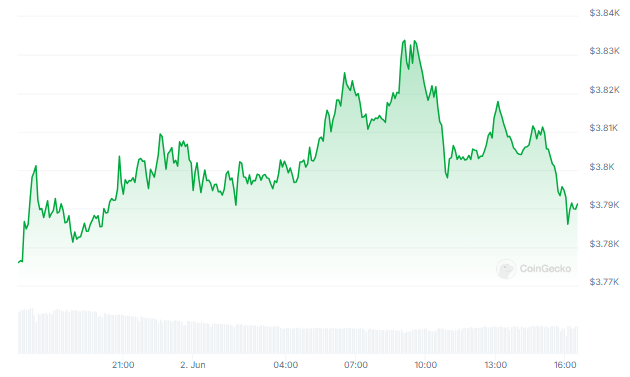
Ethereum, the world’s second-largest cryptocurrency, finds itself at a critical juncture. After a strong 25% surge in the past month, outperforming its peers, Ethereum is facing a formidable hurdle in the form of resistance levels around $3,795 and $3,846. Analysts are watching this price battle closely, as it could determine the coin’s trajectory in the coming days.
Related Reading
Breaking Barriers Or Bracing For A Tumble?
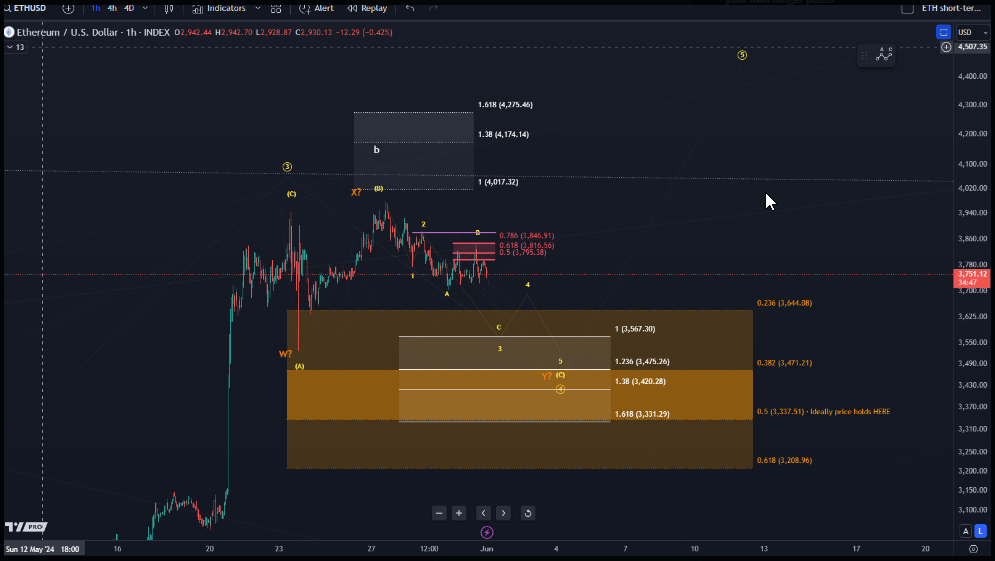
Technical analysis paints a contrasting picture for Ethereum. If the bulls can muster enough strength to push the price above $3,845, a continuation of the rally seems likely. This breakout could pave the way for a surge towards $4,015 and even a test of $4,270, according to analyst Morecryptoonl.
$ETH: Standard resistance is defined between $3,795 and $3,846. A break below $3,710 would indicate that wave c of 3 to the downside has begun. If the price breaks above $3,847, then it is worth to explore if a larger corrective rally in wave B of Y is unfolding, as per the… pic.twitter.com/gQaC1dlDaT
— More Crypto Online (@Morecryptoonl) June 1, 2024
However, a failure to breach this resistance zone could trigger a wave of selling, potentially leading to a price decline. The chart studies suggest that a break below $3,710 might mark the beginning of a downward correction, pushing Ethereum towards support levels at $3,560 and even as low as $3,470.

Key Levels To Watch
The focus for both traders and investors has shifted to these critical resistance and support levels. These price points act as a gauge for market sentiment, with a successful breakout above resistance indicating bullish strength and a potential continuation of the uptrend. Conversely, a drop below support suggests a loss of confidence among buyers and could spark a sell-off.

The overlap of these resistance and support levels on the chart further highlights their significance. This convergence indicates a potential for a price swing in either direction, making the coming days crucial for Ethereum’s future trajectory.
Ethereum Price Forecast
The Ethereum price prediction for July 2, 2024, suggests a modest upward trend, with an anticipated increase of 2.10%, bringing the price to $3,863.83. This projection is based on current market analysis and technical indicators.
The sentiment surrounding Ethereum is classified as Neutral, indicating neither a strong bullish nor bearish outlook among traders and analysts. The Fear & Greed Index, however, registers a score of 73, indicating a predominance of greed in the market. This high greed level can signify that investors are optimistic and willing to buy at higher prices, potentially driving the market up in the short term.
Related Reading
Over the past 30 days, Ethereum has experienced considerable market activity, recording green days (days with a positive price increase) 60% of the time. This frequency of green days, combined with a price volatility of 11.11%, highlights the cryptocurrency’s dynamic nature and susceptibility to significant price swings.
Featured image from Pexels, chart from TradingView
from Stock Market News – My Blog https://ift.tt/7q5SOps
via IFTTT
